

Buy to let rents are standing still across the country although there are some rental hotspots outperforming the rest. This is our rent digest for the final month of 2020.
A deep look at the latest official rent data from the Office for National Statistics highlights the Midlands and South West as the places where rents are growing the fastest.
Average private rents in England grew by 1.4% in November – a rate that is unchanged from the previous month.
In Wales, rents were up 1.6% while Scotland lags the rest of the country with a 0.6% increase.
Contents
ONS Rents – November 2020
Data from the ONS is a month behind, so the latest batch of statistics refers to November.
The average national rise was 1.4% year-on-year – much higher than the inflation rate of 0.6% recorded by the consumer price index, the government’s measure of the cost of living increases.
The rent rise adds an extra £7 to the bill of a tenant paying £500 a month a year ago.
The ONS explains that rent growth has slowed since the start of 2016, mainly influenced by a slowdown in London.
“Rental growth has started to pick up since the end of 2018, driven by strengthening growth in London. Rental growth has remained broadly flat since November 2019,” says the ONS Index of Private Housing Rental Prices.
For the UK excluding London, rents rose by 1.5% in the year to the end of November, a slight decrease from 1.6% in October.
By comparison, rents in London increased 1.1%, up from 0.9% in October.
Since the ONS started to keep rent records in January 2015, buy to let rents have gone up by 9.8%.
Rent increases by country – November 2012 to November 2020
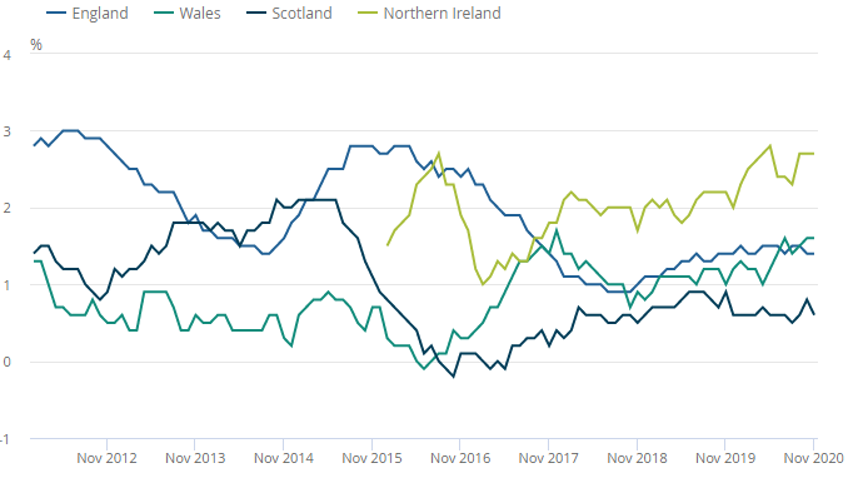
Source: ONS
Rents by region in England
The South West had the largest year-on-year rent increase – 2.3%.
The East and West Midlands were a whisker behind – both returning 2.3% rises.
The lowest rent rises were again in London and the South East – where rents were up 1.1% in the capital and 0.9% in the South East.
Rent increase in England – year to November 2020
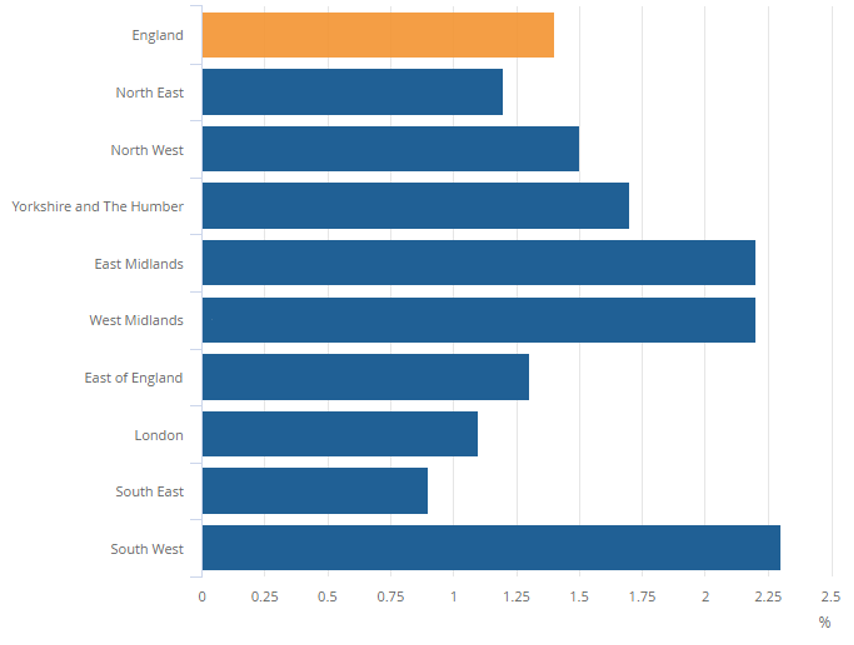
Source: ONS
Rents by region since January 2007
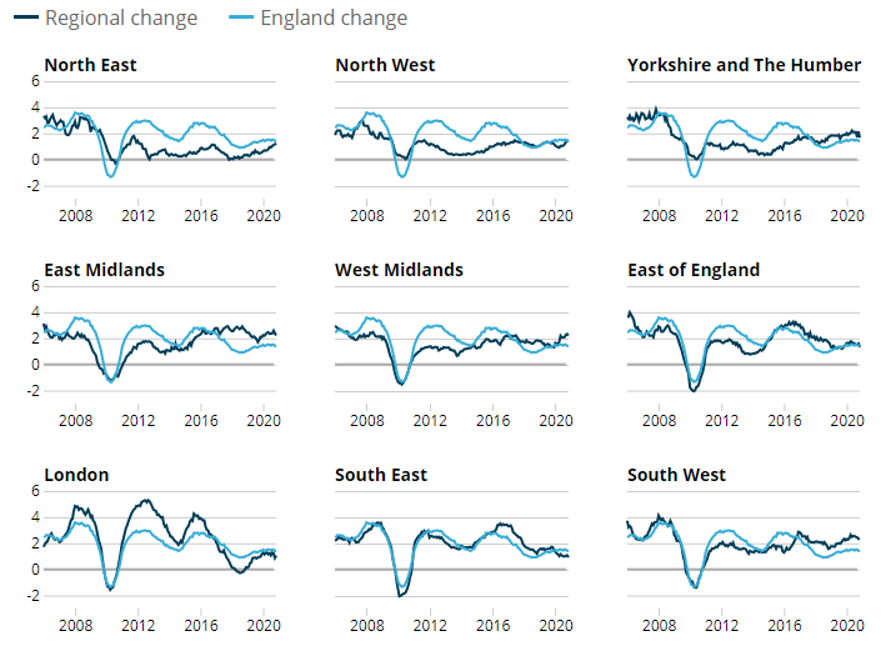
Check median rents for your local authority for different property types with this interactive map.
Source: ONS
Read the full ONS rental report for November 2020
Rent statistics from other sources
Several property businesses and other organisations produce their own rent statistics.
Here is a digest of some of the data:
Royal Institution of Chartered Surveyors (RICS)
The RICS market survey of letting agents for November shows tenant demand and the number of homes to rent are falling.
“Tenant demand was unchanged over the month. At the same time, landlord instructions fell according to a net balance of -19% of contributors. Near term rental growth expectations remain slightly positive, with most parts of the UK anticipated to see an increase. Again, for the third consecutive month, London is a clear exception, where a net balance of -63% of respondents expect rents to fall over the coming three months,” says the report.
National tenant demand
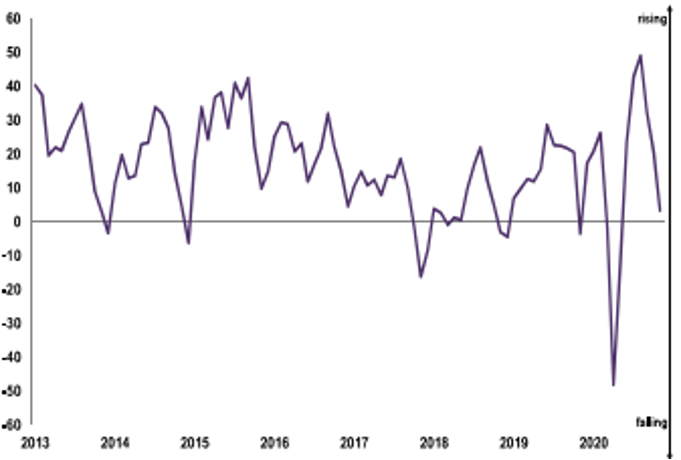
Source: RICS
National new landlord instructions
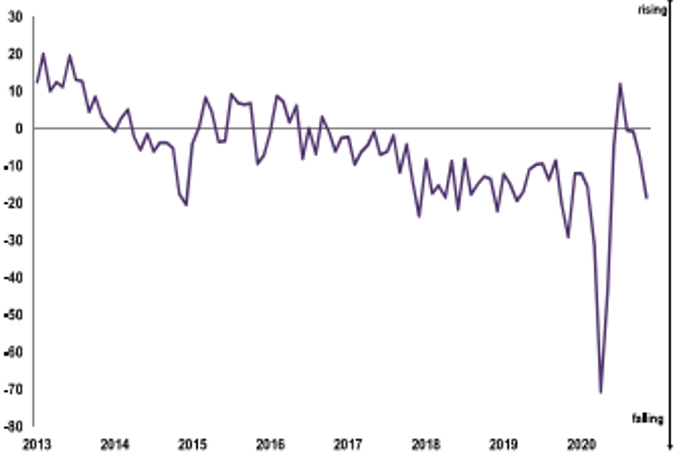
Source: RICS
Guild of Landlords Rent Digest – FAQ
For landlords confused by the stats and what they mean, here are some answers to the most asked questions about rents.
Why do the rent indices show different results?
Check the data carefully. Different indices cover different periods, and the samples vary between reports.
The ONS has the biggest sample, so should return the most reliable figures, but the time taken to collect and analyse the statistics often means the ONS data lags the rest of the sector.
ARLA derives insights from letting agents and provides what’s known in the trade as a sentiment survey rather than solid data.
Homelet statistics are based on customer data, which may not fully reflect the market.
Should landlords raise rents in line with the stats?
That’s a business decision for landlords. The rent statistics are an indication of how the market is moving but do not reflect demand from tenants and property standards in local neighbourhoods
Don’t forget the data is historical, so gives a picture of what’s happened rather than what will happen.
Which rent index is the best?
That’s up to individual landlords. One index with a strong customer base in the same area as a landlord’s portfolio may align more closely with market rents for that neighbourhood, for instance.
Average data is not much good if you don’t have an average home and median rents will cover everything from a room in a shared house to a four-bedroom home.
Extra research with local letting agents is likely to give a better view of where a landlord should pitch a competitive rent and stop them from underselling.
Although several letting agents and property organisations publish regular rent statistics, many have been affected by the coronavirus lockdown that has their reports suspended or delayed.
More statistics
You can view more statistics articles here.


